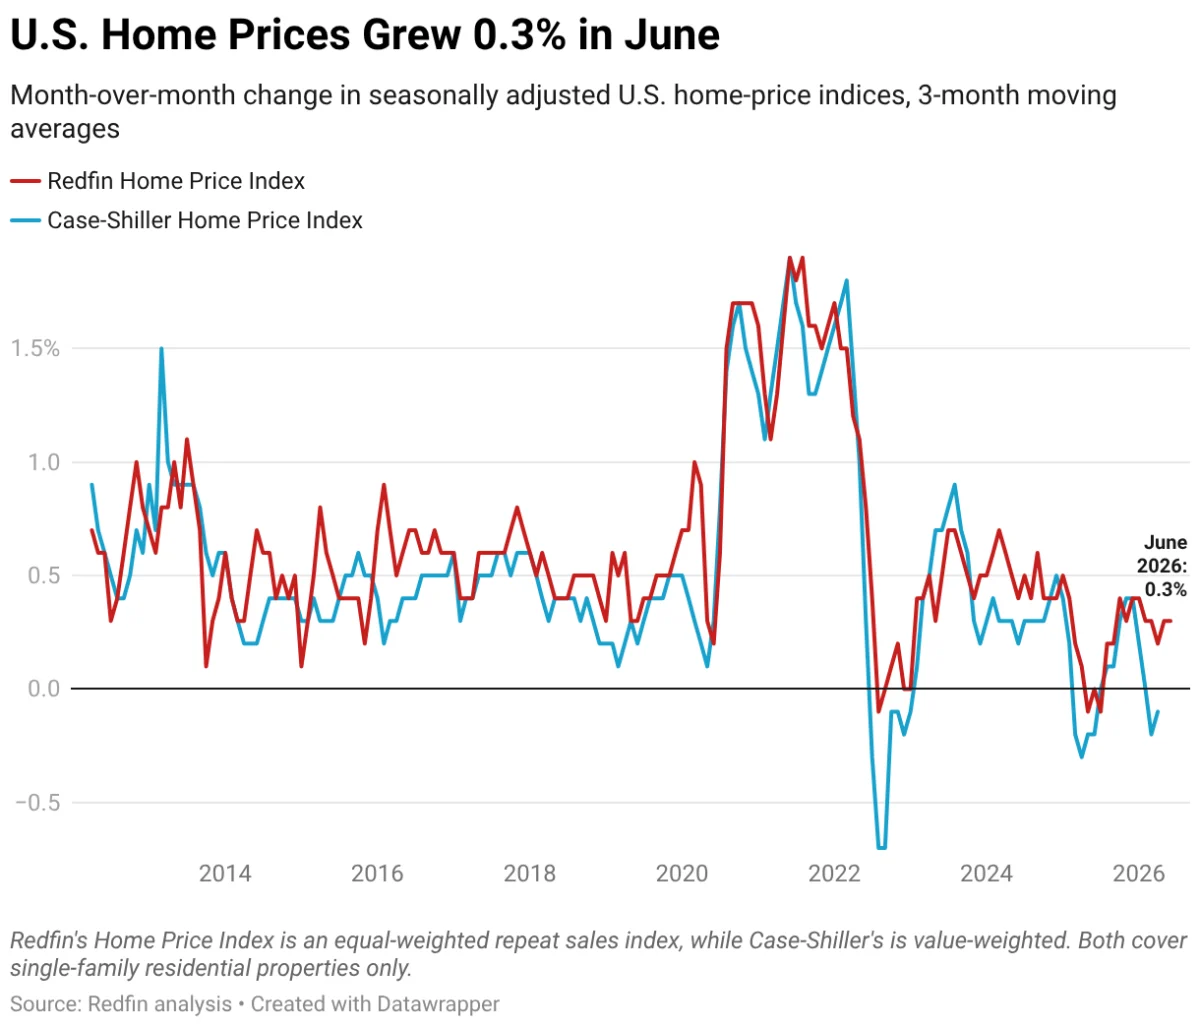
The United States housing market witnessed a significant milestone in June 2026, with home prices climbing 0.3% on a seasonally adjusted month-over-month basis. This growth rate, which matches the pace set in May, represents the fastest acceleration in property values since January of this year. According to the latest Redfin Home Price Index (RHPI), the national housing market has proven remarkably resilient despite a backdrop of elevated mortgage rates and geopolitical instability stemming from the ongoing conflict involving Iran. On an annual basis, prices rose by 3% compared to June 2025, marking the most robust year-over-year growth recorded in ten months.
The June data, which aggregates sales across the three-month period ending June 30, 2026, suggests a market characterized by a deepening divide. While the total number of sellers currently outpaces the number of active buyers across the country, a chronic shortage of affordable, move-in-ready homes has maintained upward pressure on prices. This imbalance has pushed national home prices to an all-time record high, defying expectations that higher borrowing costs would lead to a broader market correction.
A Chronology of Resilience: The First Half of 2026
The trajectory of the 2026 housing market has been defined by a steady climb in the face of significant macroeconomic headwinds. In January, the market saw an initial burst of activity as buyers attempted to lock in rates before anticipated hikes. However, as the spring season approached, the escalation of the Iran war introduced a new layer of economic uncertainty, leading to fluctuations in consumer confidence and a spike in energy costs.
By March and April, the "lock-in effect"—where homeowners with low interest rates from previous years refuse to sell—continued to stifle inventory. Although the number of listings began to rise in May and June, the quality of available inventory remained a primary concern for house hunters. The RHPI, which utilizes a repeat-sales pricing method similar to the S&P CoreLogic Case-Shiller Indices, highlights that while more homes are technically on the market, the specific segment of "turnkey" properties remains in a state of high demand and low supply. This culminated in the June report, which serves as a definitive indicator that the summer peak has arrived with record-breaking price points.
The Luxury Market and the Wealth Gap
One of the most prominent drivers of the current price surge is the booming luxury real estate sector. Data indicates that luxury home prices are currently appreciating at three times the rate of non-luxury properties. This disparity is largely attributed to the relative immunity of affluent buyers to high mortgage rates. While the average American homebuyer is often forced to wait on the sidelines due to affordability constraints, wealthy individuals are frequently transacting in cash or utilizing specialized financing that bypasses the volatility of the retail mortgage market.
In high-velocity luxury hubs such as San Francisco and South Florida, affluent buyers are continuing to move forward with purchases, viewing real estate as a stable hedge against the broader economic uncertainty caused by the Iran conflict and domestic inflation. This "unfazed" demographic is exerting an outsized influence on national averages, masking some of the cooling trends seen in the lower-priced tiers of the market.
Regional Variations: The Rise of the Midwest and the Sunbelt Correction
The June 2026 data reveals a starkly fragmented national landscape, where local economic drivers are more influential than national trends. The Midwest has emerged as a surprising leader in price growth, with Ohio metros dominating the rankings. Columbus, OH, saw the nation’s largest month-over-month uptick at 1.2%, followed closely by Cincinnati at 1.0%. Analysts suggest that the Midwest’s relative affordability and growing tech presence have made it a magnet for buyers priced out of the coastal markets.
In contrast, several prominent Sunbelt metros are experiencing a notable correction. San Antonio, TX, saw the steepest year-over-year decline at -2.7%, with Austin (-1.7%) and Phoenix (-1.4%) also seeing significant drops. These areas, which experienced explosive growth during the 2021-2023 period, are now grappling with an oversupply of inventory. In these markets, the power dynamic has shifted in favor of the buyer, with sellers frequently forced to lower their asking prices or offer concessions to close deals.
The situation in San Francisco presents a unique paradox. While the city saw a 1% decline in prices month-over-month in June, it leads the nation in year-over-year growth at 10.8%. This surge is largely credited to the localized "AI boom," which has revitalized the Bay Area’s economy and driven high-income professionals back into the housing market. The volatility in San Francisco underscores the sensitivity of high-cost markets to specific industrial cycles and shifts in the tech sector.
Economic Analysis and Expert Perspectives
Sheharyar Bokhari, a senior economist at Redfin, emphasized the importance of local context in navigating the current market. "This summer’s home sellers and buyers should pay close attention to local trends; every housing market is definitely not equal," Bokhari stated. He noted that while national headlines focus on record highs, sellers in "buyer’s markets" like Nashville or Austin must remain realistic about their pricing strategies. "Sellers in places with tighter inventory and strong demand from wealthy buyers, like San Francisco, hold more negotiating power and can likely command higher prices," Bokhari added.
The divergence between the RHPI and other indices often stems from the timing of reporting. The RHPI typically reflects market shifts about a month earlier than the Case-Shiller index, providing a more real-time look at how current events—such as the June 2026 peak of the Iran conflict—are impacting buyer behavior. The current data suggests that even with "stubbornly high" mortgage rates, the psychological floor for home prices remains high due to the fundamental lack of housing starts over the previous decade.
Supporting Data: Metro-Level Summary
The following data highlights the seasonally adjusted month-over-month and year-over-year changes for major U.S. metropolitan areas as of June 2026:
- Columbus, OH: 1.2% MoM increase; 5.6% YoY increase.
- Miami, FL: 1.1% MoM increase; 6.7% YoY increase.
- San Francisco, CA: -1.0% MoM decrease; 10.8% YoY increase.
- Nassau County, NY: 0.5% MoM increase; 10.1% YoY increase.
- Chicago, IL: -0.4% MoM decrease; 9.9% YoY increase.
- San Antonio, TX: -0.4% MoM decrease; -2.7% YoY decrease.
- Austin, TX: 0.7% MoM increase; -1.7% YoY decrease.
These figures illustrate a market in transition. In cities like Chicago and Cleveland (9.3% YoY), limited inventory continues to drive prices upward despite stagnant monthly growth. Meanwhile, in Florida, the market is split: Miami continues to see robust gains, while Jacksonville and Orlando have seen year-over-year declines of -1.8% and -1.2%, respectively, likely due to rising insurance costs and increased inventory levels.
Broader Implications for the U.S. Economy
The continued rise in home prices has significant implications for the broader U.S. economy, particularly regarding inflation and the Federal Reserve’s monetary policy. Shelter costs remain a primary component of the Consumer Price Index (CPI), and the persistence of record-high home prices complicates efforts to bring inflation back down to the 2% target.
Furthermore, the "wealth effect" generated by rising home values may be counterbalancing the Federal Reserve’s attempts to cool consumer spending. As homeowners see their equity reach new heights, they may feel more confident in their financial standing, sustaining demand in other sectors of the economy despite higher interest rates. However, for the millions of Americans still "waiting on the sidelines," the dream of homeownership is becoming increasingly elusive, potentially leading to a long-term increase in the rental population and a further widening of the wealth gap.
The geopolitical situation in the Middle East remains a wildcard. If the Iran war continues to disrupt global oil supplies, the resulting inflationary pressure could force the Federal Reserve to maintain high interest rates for longer than previously anticipated. This would further entrench the current market dynamics: a luxury-driven, low-inventory environment where price growth remains positive but inaccessible to the average first-time buyer.
As the market moves into the second half of 2026, the focus will likely shift toward whether the current "seller’s market" in the Midwest and Northeast can sustain its momentum, or if the inventory-led corrections seen in the Sunbelt will begin to spread nationwide. For now, the June data confirms that the U.S. housing market remains a fortress of value, even in an era of unprecedented global and economic volatility.