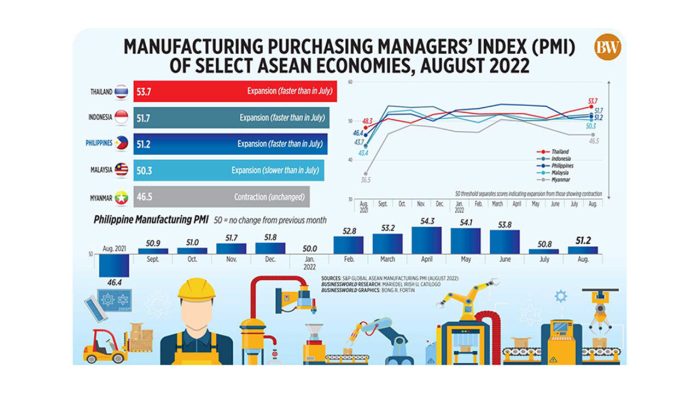
Manufacturing and Services PMIs headline Monday’s economic calendar, offering a crucial snapshot of the health of these two vital sectors. These indexes, compiled by purchasing managers, provide a forward-looking gauge of economic activity, reflecting the sentiment and expectations of businesses across the manufacturing and services industries.
PMIs are calculated using surveys of purchasing managers, who are asked to assess various aspects of their businesses, including production, new orders, employment, and inventory levels. The resulting data is then aggregated and transformed into a single index number, with a reading above 50 indicating expansion and a reading below 50 indicating contraction.
This valuable data provides insights into the current state of the economy and can be used to forecast future economic trends.
Manufacturing and Services PMIs
The Manufacturing and Services Purchasing Managers’ Indexes (PMIs) are key economic indicators that provide valuable insights into the health and direction of the manufacturing and services sectors. They are closely watched by investors, policymakers, and businesses alike, as they offer a real-time snapshot of economic activity and help predict future trends.
Overview of PMIs
The Manufacturing and Services PMIs are composite indices that measure the health of their respective sectors. They are based on surveys of purchasing managers, who are responsible for procuring goods and services for their companies. These surveys collect data on various aspects of business activity, such as production, new orders, employment, supplier deliveries, and inventories.
History of PMIs
The concept of PMIs originated in the 1980s, with the first PMI being introduced in the United States. Over the years, PMIs have gained widespread adoption globally, becoming a standard tool for economic analysis. Today, PMIs are published for a wide range of countries and regions, providing a comprehensive picture of global economic activity.
Methodology of Calculating PMIs
The calculation of PMIs involves a complex process that combines data from surveys with statistical analysis. Here are the key steps involved:
- Survey Collection:Purchasing managers are surveyed about their current business conditions and expectations for the future.
- Data Aggregation:The survey responses are aggregated and transformed into a set of indices, each representing a specific aspect of business activity.
- Index Calculation:The indices are then combined using a weighted average to create the overall PMI. The weights are determined based on the relative importance of each index.
- Interpretation:A PMI reading above 50 indicates expansion in the sector, while a reading below 50 indicates contraction. A reading of 50 represents no change.
Key Components of PMIs: Manufacturing And Services PMIs Headline Monday’s Economic Calendar
The Manufacturing and Services PMIs (Purchasing Managers’ Indices) are composite indices that provide a snapshot of the health of the manufacturing and services sectors, respectively. They are compiled from surveys of purchasing managers across a wide range of industries. The PMI is a leading indicator of economic activity, meaning that it can provide insights into the direction of the economy in the months ahead.The PMI is calculated as a weighted average of five key components, each of which reflects a different aspect of economic activity.
Components of the PMI
These five components are:
- New Orders:This component reflects the level of demand for goods and services. A rise in new orders indicates that businesses are optimistic about the future and are expecting to see increased activity. Conversely, a decline in new orders suggests that businesses are pessimistic about the future and are expecting to see a slowdown in activity.
- Production:This component reflects the level of output in the manufacturing or services sector. A rise in production indicates that businesses are increasing their output in response to increased demand. Conversely, a decline in production suggests that businesses are reducing their output in response to weak demand.
- Employment:This component reflects the level of employment in the manufacturing or services sector. A rise in employment indicates that businesses are hiring more workers in response to increased demand. Conversely, a decline in employment suggests that businesses are laying off workers in response to weak demand.
- Supplier Deliveries:This component reflects the time it takes for suppliers to deliver goods and services. A lengthening of supplier delivery times indicates that businesses are struggling to keep up with demand, which can be a sign of strong economic growth. Conversely, a shortening of supplier delivery times indicates that businesses are having difficulty selling their goods and services, which can be a sign of weak economic growth.
- Inventories:This component reflects the level of inventories held by businesses. A rise in inventories indicates that businesses are expecting to see increased demand in the future. Conversely, a decline in inventories suggests that businesses are expecting to see a slowdown in demand.
Relative Importance of Components
The relative importance of each component in reflecting economic conditions varies depending on the specific industry and the current economic climate. For example, in a period of strong economic growth, the new orders component may be more important than the employment component, as businesses are likely to be more focused on expanding their operations than on hiring new workers.
Conversely, in a period of weak economic growth, the employment component may be more important than the new orders component, as businesses are likely to be more focused on reducing costs than on expanding their operations.
Impact of Changes in Components on the PMI
Changes in the individual components of the PMI can have a significant impact on the overall PMI score. For example, if the new orders component increases significantly, this will likely lead to an increase in the overall PMI score, as it indicates that businesses are optimistic about the future and are expecting to see increased activity.
Conversely, if the employment component decreases significantly, this will likely lead to a decrease in the overall PMI score, as it indicates that businesses are pessimistic about the future and are expecting to see a slowdown in activity.
Interpreting PMI Data
The Purchasing Managers’ Index (PMI) is a valuable tool for understanding the current state of the economy and forecasting future economic trends. By analyzing PMI data, economists and investors can gain insights into the health of various sectors and make informed decisions.
Obtain recommendations related to Webster Financial CEO sells over $384,000 in company stock that can assist you today.
Understanding PMI Score Ranges
PMI scores are calculated based on surveys of purchasing managers in different industries. These surveys measure various factors related to business activity, including production, employment, new orders, and supplier deliveries. The resulting index score reflects the overall health of the manufacturing or services sector.
- A PMI score above 50 indicates expansion, meaning that businesses are generally optimistic about the economy and are increasing their activity.
- A PMI score below 50 indicates contraction, suggesting that businesses are experiencing a slowdown in activity and are becoming more pessimistic about the economic outlook.
- A PMI score of 50 represents no change, indicating that economic activity is stable.
Using PMI Data for Economic Forecasting
PMI data can be used to forecast future economic trends by analyzing the direction and magnitude of changes in the index.
- A sustained increase in the PMI score indicates a strengthening economy and suggests that growth is likely to continue.
- A sustained decrease in the PMI score indicates a weakening economy and suggests that a recession may be on the horizon.
- Significant changes in the PMI score, such as a sudden drop or surge, can signal a turning point in the economy.
Interpreting Key PMI Components
Analyzing the different components of the PMI can provide further insights into the underlying drivers of economic activity.
- New Orders: This component reflects the level of demand for goods and services. A strong increase in new orders suggests that businesses are confident about the future and are likely to increase production.
- Production: This component measures the level of output in the manufacturing or services sector. A rise in production indicates that businesses are expanding their operations and are optimistic about the future.
- Employment: This component reflects the level of hiring activity in the sector. A rise in employment suggests that businesses are confident about future growth and are willing to invest in their workforce.
- Supplier Deliveries: This component measures the time it takes for suppliers to deliver goods and services. A longer lead time suggests that businesses are experiencing supply chain bottlenecks, which can indicate a potential constraint on economic growth.
Comparing Manufacturing and Services PMIs
The Manufacturing and Services PMIs provide insights into the performance of different sectors of the economy.
- Manufacturing PMI: This index focuses on the manufacturing sector, which is heavily influenced by global trade and investment. A decline in the Manufacturing PMI could indicate a weakening global economy.
- Services PMI: This index focuses on the services sector, which is more sensitive to domestic economic conditions. A decline in the Services PMI could indicate a slowdown in consumer spending or business investment.
Examples of PMI Data Analysis
- Example 1: In 2023, the US Manufacturing PMI fell below 50, indicating contraction in the sector. This was attributed to rising inflation, supply chain disruptions, and slowing global demand.
- Example 2: In 2021, the US Services PMI surged above 50, indicating strong growth in the sector. This was driven by pent-up demand following the COVID-19 pandemic and government stimulus measures.
Impact of PMIs on Markets
The release of Purchasing Managers’ Indexes (PMIs) can significantly impact financial markets, particularly stocks, bonds, and currencies. Investors and traders closely watch these economic indicators to gauge the health of the manufacturing and services sectors, which are crucial drivers of overall economic growth.
Impact on Stock Markets
PMIs provide valuable insights into the current state of the economy and future economic prospects. A strong PMI reading, indicating robust economic activity, can boost investor confidence and lead to higher stock prices. Conversely, a weak PMI reading, signaling slowing economic growth, can trigger a sell-off in the stock market as investors become more cautious.
Impact on Bond Markets
PMIs also influence bond markets. A strong PMI reading can lead to higher interest rates as investors anticipate stronger economic growth and inflation. Higher interest rates make bonds less attractive, leading to lower bond prices. Conversely, a weak PMI reading can result in lower interest rates as investors seek safer investments in bonds.
Impact on Currencies, Manufacturing and services PMIs headline Monday’s economic calendar
PMIs can impact currency exchange rates. A strong PMI reading can strengthen a country’s currency as investors become more optimistic about its economic prospects. Conversely, a weak PMI reading can weaken a country’s currency as investors lose confidence in its economic outlook.
How Investors Use PMI Data
Investors and traders use PMI data to make informed investment decisions. They analyze the data to:
- Assess the overall health of the economy and identify potential trends.
- Predict future economic performance and make informed investment decisions.
- Adjust their investment strategies based on the latest PMI data.
Implications of Unexpected PMI Results
Unexpected PMI results can have significant implications for markets. A surprisingly strong PMI reading can trigger a rally in stocks and bonds, while a surprisingly weak PMI reading can lead to a sell-off. These unexpected results can also influence currency exchange rates.
For example, if a PMI reading comes in significantly higher than expected, it could signal that the economy is growing faster than anticipated. This could lead to higher interest rates, which could hurt bond prices. It could also boost investor confidence and lead to higher stock prices.
Manufacturing and Services PMIs
The Manufacturing and Services Purchasing Managers’ Indices (PMIs) provide valuable insights into the health and trajectory of these two critical sectors of the economy. While both PMIs reflect economic activity, they often exhibit distinct trends, revealing the nuances of each sector’s performance.
Manufacturing and Services PMIs: Sectoral Analysis
The Manufacturing PMI gauges the health of the manufacturing sector, encompassing activities like production, new orders, employment, and supplier deliveries. Conversely, the Services PMI focuses on the services sector, encompassing activities like business activity, new orders, employment, and outstanding business.
Examining the differences and similarities between these PMIs helps understand the broader economic landscape.
- Manufacturing PMI:Often more volatile than the Services PMI, the Manufacturing PMI is susceptible to global economic fluctuations, commodity price swings, and changes in trade patterns. The sector’s dependence on global supply chains makes it particularly sensitive to disruptions, such as those experienced during the COVID-19 pandemic.
- Services PMI:The Services PMI tends to be more stable, reflecting the sector’s reliance on domestic demand. However, the Services PMI can be influenced by factors such as consumer confidence, interest rates, and government policies.
The table below showcases the historical trends in Manufacturing and Services PMIs in the United States, highlighting key differences and similarities.
| Year | Manufacturing PMI | Services PMI | Key Differences |
|---|---|---|---|
| 2019 | 52.4 | 55.1 | Services sector outpaced manufacturing growth, reflecting strong consumer spending. |
| 2020 | 47.8 | 47.5 | Both sectors experienced significant contraction due to the COVID-19 pandemic. |
| 2021 | 58.3 | 58.8 | Both sectors rebounded strongly, driven by pent-up demand and government stimulus. |
| 2022 | 50.5 | 54.7 | Services sector remained robust, while manufacturing growth slowed due to supply chain bottlenecks and inflation. |
Global Perspective on PMIs
The global PMI landscape provides a comprehensive view of economic health across different regions. Analyzing PMI data from major economies allows us to understand the interconnectedness of global economic trends and their impact on individual countries.
Comparison of PMI Data for Major Economies
PMI data offers valuable insights into the manufacturing and services sectors of major economies worldwide. Comparing these figures reveals the relative strength or weakness of economic activity in different regions. For instance, the Eurozone’s PMI data has often been closely watched for signs of economic recovery, while the United States’ PMI data has been a key indicator of overall economic health.
- Eurozone:The Eurozone’s composite PMI, which combines manufacturing and services data, has been volatile in recent years, reflecting the challenges of economic integration and the impact of global events.
- United States:The US PMI data has generally been more stable, reflecting the resilience of the American economy. However, recent data has shown signs of slowing growth, particularly in the manufacturing sector.
- China:China’s PMI data has been a key indicator of global economic growth, as the country is a major manufacturing hub and a significant consumer market.
- Japan:Japan’s PMI data has been relatively stable, but the country has faced challenges in recent years due to a weak yen and sluggish consumer spending.
Impact of Global Economic Trends on PMI Performance
Global economic trends, such as changes in interest rates, commodity prices, and trade policies, can have a significant impact on PMI performance in different regions. For example, a rise in interest rates in the United States can lead to a slowdown in economic activity in other countries, as businesses and consumers become more cautious about borrowing and spending.
- Trade Wars:Trade wars can disrupt global supply chains and lead to increased uncertainty for businesses, which can negatively impact PMI performance.
- Commodity Price Fluctuations:Fluctuations in commodity prices can impact the cost of production for businesses, leading to changes in PMI readings. For example, a surge in oil prices can increase costs for manufacturers, potentially leading to a decline in the manufacturing PMI.
- Global Economic Slowdowns:Global economic slowdowns can lead to a decline in demand for goods and services, which can negatively impact PMI performance in various countries.
Implications of Diverging PMI Trends Across Countries
Diverging PMI trends across countries can indicate differences in economic performance and growth prospects. For example, a strong PMI reading in one country, while others are experiencing weakness, could suggest that the country is relatively insulated from global economic headwinds.
- Investment Opportunities:Diverging PMI trends can create investment opportunities for investors seeking to capitalize on differences in economic performance. For example, investors might be attracted to countries with strong PMI readings, as they are likely to experience higher growth and profitability.
- Policy Implications:Diverging PMI trends can also have implications for policymakers. For example, a country with a weak PMI reading might need to implement policies to stimulate economic growth, while a country with a strong PMI reading might need to address potential inflationary pressures.
Limitations of PMIs
While PMIs offer valuable insights into the manufacturing and services sectors, it’s crucial to acknowledge their limitations. They are not a perfect reflection of the entire economy and should be interpreted alongside other economic indicators.
Factors Influencing PMI Data Accuracy
The accuracy of PMI data can be influenced by several factors:
- Sample Size and Representation:PMIs are based on surveys of a limited number of companies, which may not accurately represent the entire sector. The sample size and composition can affect the data’s reliability, especially in industries with a large number of small businesses.
- Survey Bias:Respondents’ opinions and perceptions can be influenced by factors such as their own business performance, industry trends, and economic outlook. This can lead to bias in the data, potentially skewing the overall PMI score.
- Seasonality and Cyclical Factors:Economic activity can fluctuate seasonally, and PMI data may reflect these cyclical patterns. For instance, manufacturing activity may be higher during the holiday season due to increased demand. It’s essential to consider seasonal adjustments when analyzing PMI data.
- Data Lag:PMIs are typically released with a lag of a few weeks, meaning they reflect past economic activity. This delay can make it challenging to gauge the current state of the economy.
Using PMIs in Conjunction with Other Economic Indicators
To gain a more comprehensive understanding of the economy, PMIs should be considered alongside other economic indicators, such as:
- Gross Domestic Product (GDP):GDP measures the total value of goods and services produced in a country. It provides a broader perspective on economic growth and performance than PMIs.
- Employment Data:Unemployment rates, job creation figures, and labor market indicators offer insights into the health of the workforce and consumer spending.
- Inflation Data:Inflation measures the rate at which prices increase. It provides information about the purchasing power of consumers and the cost of doing business.
- Consumer Confidence Surveys:Consumer confidence surveys gauge consumer sentiment about the economy. They can provide early indications of changes in spending patterns and overall economic outlook.
Last Word

Understanding Manufacturing and Services PMIs is essential for anyone seeking to grasp the pulse of the economy. These indexes provide a valuable tool for investors, policymakers, and businesses alike, offering insights into the current state of the economy and its future trajectory.
As the economic landscape continues to evolve, staying informed about the latest PMI releases is crucial for making informed decisions and navigating the complexities of the global marketplace.
Clarifying Questions
What is the difference between Manufacturing and Services PMIs?
Manufacturing PMIs focus on the manufacturing sector, encompassing industries such as production, construction, and mining. Services PMIs, on the other hand, focus on the services sector, encompassing industries such as retail, finance, and transportation.
How frequently are PMIs released?
PMIs are typically released monthly, providing a regular update on the health of the economy. These releases are often eagerly awaited by investors and analysts as they can significantly impact market sentiment and investment decisions.
What are the potential limitations of using PMIs as an economic indicator?
While PMIs are a valuable tool, it’s important to note that they are not a perfect indicator of economic health. They are based on surveys, which can be subject to biases and sampling errors. Additionally, PMIs may not always capture the full extent of economic activity, particularly in emerging markets or industries that are not adequately represented in the surveys.
 CentralPoint Latest News


