
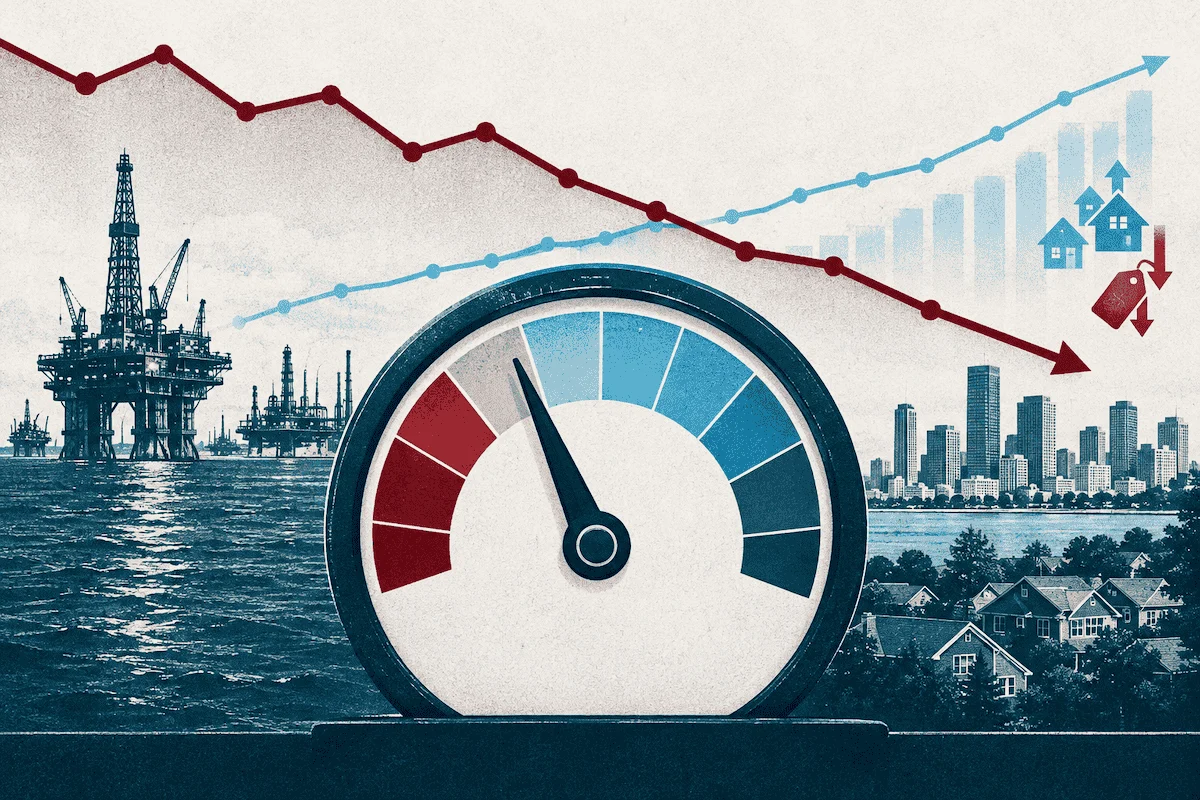
The United States housing market experienced a subtle shift in momentum last week as a slight cooling in mortgage rates provided a reprieve from a prolonged period of declining demand. After reaching a peak near 7.60%, mortgage rates retraced toward the 7.30% threshold, effectively halting the precipitous slide in buyer activity that has characterized much of October 2026. This modest recovery, while limited in scope, serves as a critical indicator of how sensitive the current housing landscape remains to fluctuations in the broader bond market. As the industry navigates a year defined by geopolitical volatility, shifting economic data, and aggressive monetary policy, the stabilization of the 10-year Treasury yield has become the focal point for analysts monitoring the health of the real estate sector.
The Bond Market and the 10-Year Yield Anchor
The volatility observed throughout October has been inextricably linked to the performance of the 10-year Treasury yield, which serves as the primary benchmark for 30-year fixed mortgage rates. For much of the month, market participants have closely monitored a key technical support level of 5.35%. Throughout October, the yield has faced upward pressure from firm economic data and elevated oil prices—factors that traditionally signal inflationary risks and keep yields high.
However, a softening in the narrative surrounding Artificial Intelligence (AI) sector investments, combined with a tactical retreat in bond yields, allowed the 10-year yield to dip below the 5% mark last week. This development was a significant relief for mortgage lenders and prospective homebuyers alike. For several weeks, market speculation had centered on the potential for mortgage rates to breach the 8% or even 9% thresholds, a scenario that would have undoubtedly triggered a deeper contraction in home sales. Current analysis suggests that as long as the 10-year yield remains anchored below the 5.35% level, the extreme volatility that characterized early autumn can be contained, preventing a worst-case scenario for mortgage affordability.
Mortgage Spreads and Financial Volatility
While the nominal mortgage rate is the figure most consumers see, the underlying "spread"—the gap between the 10-year Treasury yield and the average 30-year fixed mortgage rate—remains a vital metric for market health. Since the Federal Reserve initiated its rate-hike cycle in 2022, these spreads have been uncharacteristically wide. Historically, mortgage spreads have fluctuated between 1.60% and 1.80%. In contrast, the current environment has seen these spreads widen to 2.23%, a slight increase from the previous week’s 2.21%.
The widening of these spreads is a functional response to market instability. Lenders often expand the margin between their cost of borrowing and the rate offered to consumers to account for heightened volatility and prepayment risk. Financial analysts maintain that a healthy market requires these spreads to trend closer to the 2% range. When the 10-year yield moves sharply in either direction, lenders frequently adjust their spreads to manage risk, which often offsets some of the benefits borrowers might otherwise see from a drop in the underlying Treasury yield. This dynamic remains a primary hurdle to improving housing affordability in the current cycle.
Tracking Housing Demand: Pending Sales and Purchase Applications
Weekly pending home sales data provides a real-time pulse on the market, typically acting as a leading indicator that precedes closed sales by 30 to 60 days. Following several weeks of consistent decline, the recent dip in mortgage rates finally brought a halt to the downward trajectory, resulting in a marginal positive print. While this is technically an improvement, market experts caution against interpreting this as a sustained reversal. The decline in demand had been accelerating, and a minor stabilization should be viewed as a cessation of bleeding rather than a return to growth.
Historical data suggests a strong correlation between mortgage rates and demand velocity. In the first half of 2026, when mortgage rates consistently remained below the 6.64% threshold, the market exhibited healthy growth, hindered only by seasonal factors such as winter weather and holidays. Conversely, whenever rates have climbed above 7%, the data has consistently shown softening demand.
Purchase application data, which tracks mortgage requests for new home purchases, continues to reflect the cooling effect of higher interest rates. Because purchase applications look out 30 to 90 days, the most recent data points do not yet fully capture the relief provided by last week’s lower rates. However, even before the recent downward adjustment, applications remained depressed on both a week-to-week and year-over-year basis. The persistent pressure of rates above 7% has created a structural barrier for many first-time buyers, leading to a visible decline in overall application volume throughout the latter half of 2026.
Inventory Dynamics and the Seller’s Dilemma
Housing inventory growth has remained uncharacteristically tame throughout 2026. While inventory typically expands when rates rise due to a lack of buyer interest, the current environment is unique. We are seeing slower inventory growth compared to previous cycles, partially because the market has adjusted to a "new normal" regarding available supply. Since mid-August, inventory levels have begun to creep upward, aided by easier year-over-year comparisons; at this time last year, rates were 1% lower and buyer demand was surging toward a nine-month high. Current inventory growth is running at approximately 5.68%.
New listings have followed a typical seasonal decline as the year draws to a close. Despite this, 2026 has been marked as the healthiest year for new listings since 2022, with weekly volume occasionally surpassing 80,000. A growing concern among industry observers is the "lock-in" effect: as most home sellers are also potential homebuyers, the prospect of trading a low-interest-rate mortgage for a 7% rate is keeping many potential sellers on the sidelines. If this trend intensifies, it could further constrict the supply of available homes, keeping prices elevated despite softer demand. To put current levels in perspective, during the peak of the housing bubble, new listings frequently ranged between 250,000 and 400,000 per week, highlighting the current structural scarcity of the market.
Price Adjustments and Market Valuation
The percentage of homes undergoing price reductions serves as a barometer for buyer sentiment. Typically, one-third of homes experience a price cut before closing. For most of 2026, this percentage remained lower than the previous year. However, as mortgage rates breached the 6.64% and 7% thresholds, the data shifted. Currently, the price-cut percentage is 1% higher year-over-year, reflecting the reality that sellers are having to adjust their expectations to meet a shrinking pool of qualified buyers.
Despite these adjustments, home prices have shown remarkable resilience. Earlier forecasts for 2026 projected a modest national decline of 0.62%. However, current home-price indexes indicate actual growth in the 1% to 2% range. This indicates that while demand has softened, the lack of inventory continues to place a floor under home values, preventing the significant corrections that many analysts initially predicted.
The Week Ahead: Geopolitical and Monetary Outlook
As the industry moves into the final week of October, the outlook remains clouded by global uncertainty. Oil prices continue to trade at yearly highs, a factor that complicates the Federal Reserve’s inflation mandate and keeps bond yields sensitive to external shocks. Geopolitical tensions, particularly regarding the situation in Iran, are being watched closely for their potential to disrupt energy markets and further destabilize interest rates.
Furthermore, the domestic focus is squarely on the upcoming Federal Reserve meeting. Market participants are looking for clarity on the trajectory of interest rates as the central bank attempts to balance inflation control with economic stability. Investors are also monitoring high-yield credit spreads; a significant widening would signal a potential cooling in the AI-driven investment boom, which could have cascading effects on the broader economy.
For the housing sector, the goal for the remainder of the year is simple: maintain stability in the 10-year Treasury yield. As long as the market can avoid a closing yield above 5.35%, the housing sector may be able to navigate the final months of 2026 without further systemic disruption. The combination of seasonal cooling, persistent inflationary pressure, and the looming policy decisions by the Federal Reserve suggests a period of cautious navigation for stakeholders throughout the remainder of the quarter.