
The United States housing market is currently navigating a period of significant adjustment as of mid-September 2026. For the four-week period ending September 13, prospective homebuyers have found themselves in a unique position: while the cost of borrowing has surged to levels not seen since early 2025, those who remain active in the market are benefiting from a distinct shift in dynamics. With fewer buyers competing for available inventory, participants are encountering more options and a greater degree of negotiating power than has been observed in recent years. This cooling effect, driven by elevated mortgage rates and a cautious economic climate, marks a transition from the hyper-competitive environment that defined the post-pandemic housing surge.
Chronology of Market Conditions
The current state of the market did not materialize overnight. Following the volatility of 2024 and the inflationary pressures of 2025, the housing sector began 2026 with a cautious outlook. By the late summer of 2026, the Federal Reserve’s monetary policy stance continued to influence mortgage interest rates, which directly dictated homebuyer sentiment. As of September 16, 2026, the daily average for a 30-year fixed mortgage rate climbed to 7.24%, a sharp increase from the 6.97% reported just one week prior. This upward trajectory has acted as a primary inhibitor for prospective purchasers, many of whom have opted to wait on the sidelines.
Weekly data from Freddie Mac for the period ending September 10, 2026, places the average 30-year fixed mortgage rate at 6.76%, representing a notable increase from the 6.35% recorded at the same time last year. This steady ascent in borrowing costs has led to a measurable decline in demand. Mortgage-purchase applications, as tracked by the Mortgage Bankers Association, fell by 1% for the week ending September 11, marking a significant 19% decrease compared to the same period in 2025. This reduction in application volume underscores the sensitivity of the market to interest rate fluctuations.
Indicators of Diminished Demand
Beyond mortgage applications, other leading indicators confirm a slowdown in consumer interest. Google search trends for the term "homes for sale" have plummeted by 12% over the last month and are down 15% year-over-year as of September 12. Similarly, data from ShowingTime, which tracks physical touring activity, reveals that home visits are down 3% compared to the start of 2026. This is a stark contrast to the same period last year, when touring activity was trending upward by 26%, highlighting a definitive cooling in buyer enthusiasm.
Current Valuation and Inventory Dynamics
Despite the drop in demand, home prices have shown resilience, though they are no longer experiencing the aggressive growth of previous years. For the four weeks ending September 13, 2026, the median sale price for a U.S. home stood at $397,633, a modest 2% increase year-over-year. The median asking price remained relatively stagnant, showing a marginal 0.1% increase, which suggests that sellers are beginning to align their expectations with the reality of higher borrowing costs.
The median monthly mortgage payment, adjusted for seasonal factors, is now $2,633 based on a 6.76% interest rate. This represents a 3.4% increase from last year, further tightening the budgets of middle-income households. Perhaps the most telling metric regarding the current state of the market is the volume of pending sales. At 299,126, pending sales are down 5.4% year-over-year and 3.5% week-over-week, hitting the lowest level in nearly three years. This contraction in contract signings is a clear signal that the urgency that once characterized the market has dissipated.
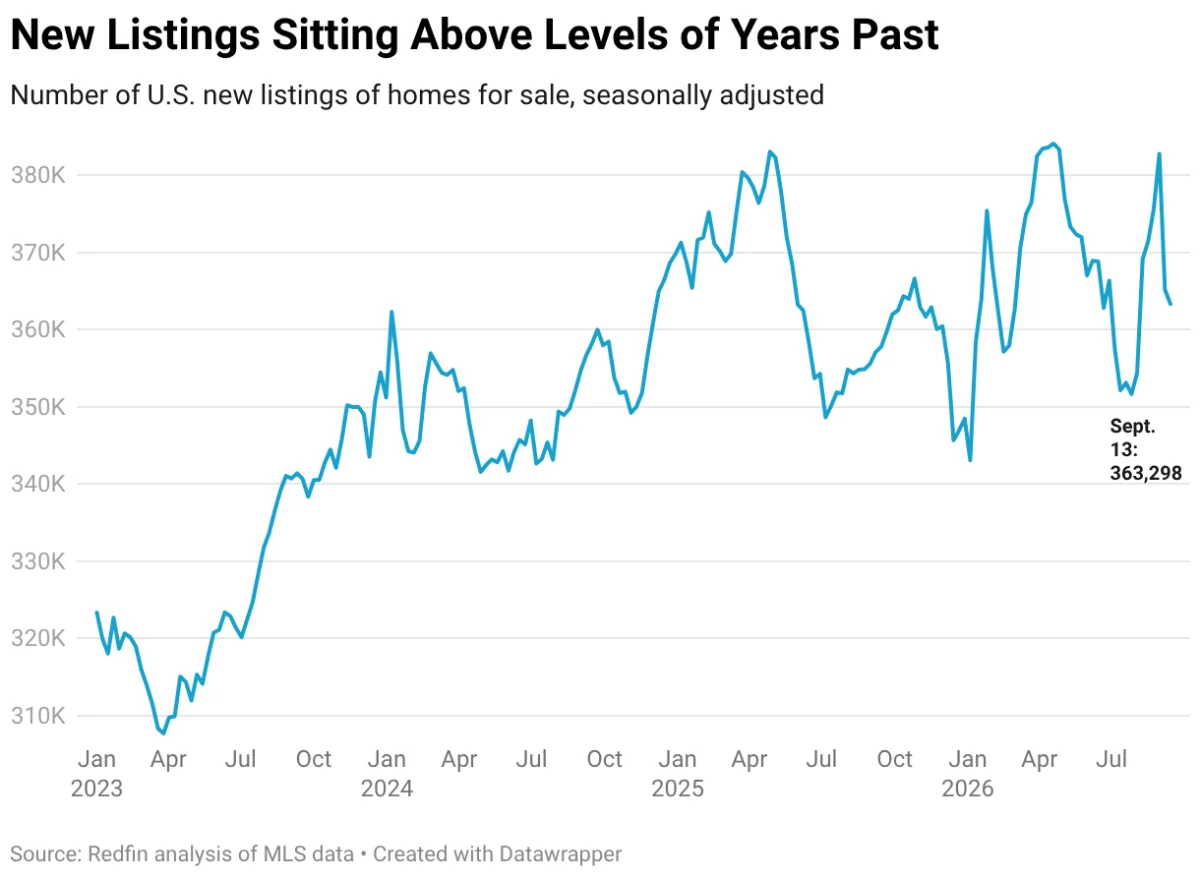
Inventory levels remain a point of interest for analysts. New listings rose by 1.5% year-over-year to 363,298, while active listings also saw a 1.5% increase. With 4.1 months of supply currently on the market, the sector is moving toward a more balanced state. Economists generally consider a four-to-five-month supply of homes to be the threshold for a balanced market; anything lower tends to favor sellers, while a higher supply indicates a buyer’s market. The current shift toward 4.1 months of supply provides a growing window for buyers to conduct due diligence, compare properties, and enter into negotiations without the pressure of immediate, multiple-offer bidding wars.

Regional Variations and Divergent Trends
The national averages mask a complex landscape of regional variations across the 50 most populous U.S. metropolitan areas. Price appreciation has been strongest in the Midwest and parts of the West Coast, with San Francisco leading the nation with a 10.2% year-over-year increase in median sale prices. Milwaukee (9.3%), Kansas City (7.9%), Cleveland (7.6%), and St. Louis (6.8%) also posted significant gains, suggesting that these regions remain relatively affordable or have seen a late-cycle surge in demand.
Conversely, several markets are experiencing price corrections. San Jose, California, saw a 5% decline in median sale prices, followed by Austin, Texas (-4.6%), San Antonio (-4.3%), Seattle (-3.9%), and Fort Worth, Texas (-3.1%). These declines often correlate with regions that saw the most aggressive price growth during the pandemic-era housing boom, indicating that the current cooling period is effectively recalibrating values in overheated markets.
Pending sales metrics show a similar divide. While Florida markets such as Fort Lauderdale (6.6%) and Miami (4%) are seeing modest growth in contract signings, major hubs like Seattle (-20.3%), Denver (-15%), and San Diego (-14.7%) are seeing steep declines in pending transactions. This suggests that the impact of rising interest rates is being felt most acutely in markets where home prices are highest relative to local income levels.
Market Implications and Future Outlook
The current housing market trajectory carries several implications for the broader economy. First, the increase in the share of listings with price drops—now at 20.8%, up from 19.7% a year ago—indicates that sellers are acknowledging the shift in buyer sentiment. While 25.1% of homes are still selling above list price, the average sale-to-list price ratio of 98.6% suggests that most transactions are closing at or slightly below the initial asking price.
For buyers, the cooling market offers a rare reprieve from the frantic pace of recent years. With a median of 46 days on the market—unchanged from last year—buyers have more time to secure financing, schedule inspections, and negotiate concessions. However, the hurdle of high interest rates remains a formidable barrier to entry, particularly for first-time buyers who lack equity from a previous home sale.
For sellers, the current environment necessitates a more strategic approach. The days of listing a property and receiving multiple offers within hours are largely over in many zip codes. Success in the current market requires accurate pricing based on recent comparable sales and a willingness to engage in negotiations regarding terms, repairs, and closing costs.
As the industry moves into the final quarter of 2026, the focus will remain on the Federal Reserve’s upcoming policy decisions. Any movement in the federal funds rate will likely dictate the path of mortgage rates, which remains the single most influential variable for housing demand. Until rates stabilize or move downward, the market is expected to remain in this period of adjustment, characterized by moderate inventory growth, stable or slightly cooling prices, and a more methodical, less emotional approach to real estate transactions. Analysts advise that while the "seller’s market" advantage is waning, the fundamental scarcity of housing in many major metropolitan areas will likely prevent a total collapse in valuations, keeping the market firmly in a state of cautious transition.