
The American housing market is currently navigating a complex transition period characterized by a distinct shift in power dynamics. For the four-week period ending September 13, 2026, prospective homebuyers have found themselves in a unique position: while borrowing costs have climbed to levels not seen in over a year, the cooling of overall demand has provided those remaining in the market with significantly more leverage, a broader selection of inventory, and reduced competition compared to the frantic pace of previous years.
The Macroeconomic Environment and Rising Rates
The defining narrative of this period is the upward trajectory of interest rates, which continues to exert pressure on affordability. As of September 16, 2026, the daily average 30-year fixed mortgage rate reached 7.24%, a notable climb from 6.97% just one week prior. This figure places borrowing costs at their highest point since January 2025. On a weekly average basis, Freddie Mac reported a rate of 6.76% for the week ending September 10, up from 6.67% the previous month and significantly higher than the 6.35% recorded during the same period in 2025.
This sustained high-interest-rate environment has effectively sidelined a large segment of the potential buyer pool. Mortgage purchase applications, a key leading indicator of future sales volume, declined by 1% week-over-week as of September 11, and show a stark 19% decrease compared to the same period last year. The decline in interest is mirrored in digital engagement, with Google searches for the phrase "homes for sale" dropping 12% from a month earlier and 15% year-over-year. Touring activity, as tracked by ShowingTime, has remained stagnant, hovering 3% below the start-of-year levels, a stark contrast to the robust 26% growth observed at this time in 2025.
Market Dynamics: Pricing and Inventory Trends
Despite the cooling demand, home prices have shown remarkable resilience, indicating that the supply-demand imbalance remains a structural feature of the current landscape. The national median sale price for the four weeks ending September 13 stood at $397,633, marking a 2% increase year-over-year. The median asking price, which has been seasonally adjusted, remained largely flat with a marginal 0.1% increase.
The median monthly mortgage payment, adjusted for current interest rates, has risen by 3.4% year-over-year to $2,633. This elevation in monthly costs, coupled with stagnant wage growth in many sectors, has contributed to a sharp reduction in market activity. Pending sales, a leading indicator for closed transactions, have fallen to their lowest levels in nearly three years. For the period ending September 13, pending sales saw a 5.4% year-over-year decline and a 3.5% drop from the previous week, suggesting that the housing market may experience a sluggish end to the third quarter.
However, for those who remain active in the market, the environment is increasingly favorable. With 4.1 months of supply—approaching the 4-to-5-month threshold traditionally defined as a balanced market—buyers are finding that homes are sitting on the market longer. The median number of days on market remains steady at 46, but the share of listings experiencing price drops has climbed to 20.8%, up from 19.7% last year. This provides clear evidence that sellers are increasingly forced to adjust their expectations to meet the current reality of buyer purchasing power.
Regional Divergence in Real Estate Performance
The national statistics mask significant variations in performance across major metropolitan areas. Geography, local economic health, and previous pandemic-era surges are playing a critical role in how specific regions are weathering the current cycle.

In the median sale price category, San Francisco leads the nation with a 10.2% year-over-year increase, followed by Milwaukee (9.3%) and Kansas City (7.9%). These gains suggest that certain markets, particularly those that may have been undervalued or experienced recent economic revitalization, continue to see upward price pressure. Conversely, the "tech-heavy" and pandemic-boom markets are seeing the most significant corrections. San Jose, California, recorded a 5% decline in median sale prices, while Austin, Texas, and San Antonio saw drops of 4.6% and 4.3%, respectively. Seattle and Fort Worth, Texas, rounded out the top five largest declines, signaling a cooling trend in markets that previously saw rapid, unsustainable appreciation.
Pending sales activity further highlights this regional divergence. While Florida markets like Fort Lauderdale and Miami are seeing a surprising uptick in pending sales—growing 6.6% and 4%, respectively—major urban hubs in the West and South are struggling. Seattle, Denver, and San Diego have experienced the most significant contractions in pending sales, with declines of 20.3%, 15%, and 14.7%, respectively. These figures reflect a broader shift in consumer confidence and the cooling of investment demand in areas that were previously considered "hot" markets.
The Changing Relationship Between Buyers and Sellers
The current real estate landscape represents a departure from the "seller’s market" dominance that defined the post-pandemic recovery. While 25.1% of homes are still selling above list price, this is a narrow majority compared to the wider market, and the average sale-to-list price ratio remains at 98.6%.
The data suggests that the market is normalizing, albeit at a higher cost-of-capital floor. Sellers who are unrealistic about current pricing are finding their properties lingering on the market, while buyers are becoming more selective and increasingly willing to walk away from properties that do not meet their specific criteria or valuation expectations. The increase in the share of listings with price reductions indicates that the market is in a discovery phase, where buyers and sellers are attempting to find a new equilibrium price point that accounts for 7% interest rates.
Broader Economic Implications and Outlook
The housing sector remains a critical pillar of the U.S. economy, and its current performance is being closely monitored by policymakers and economists. The combination of high interest rates and low inventory—often referred to as the "lock-in effect," where homeowners with low mortgage rates are reluctant to move and take on a higher rate—is creating a gridlock that limits transaction volume.
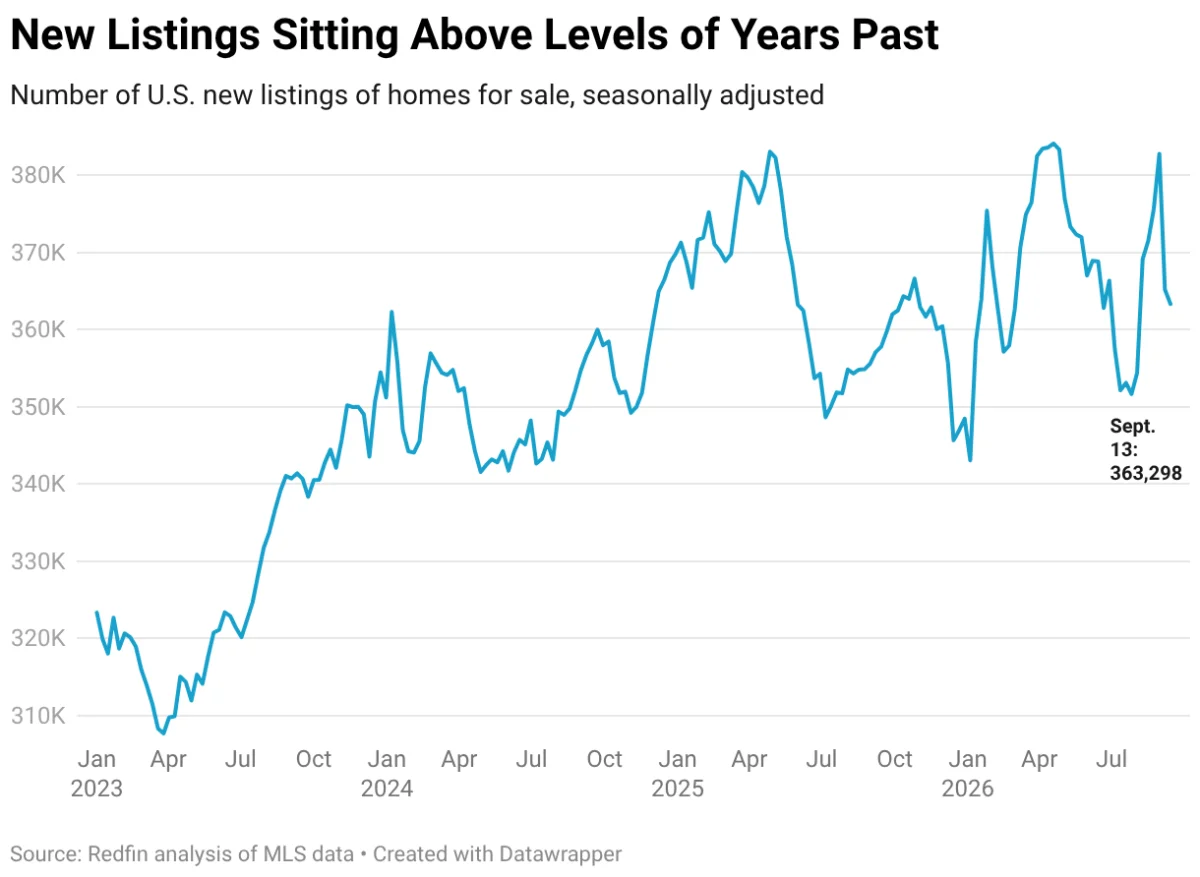
The 1.5% year-over-year increase in both new and active listings suggests a minor thawing of this gridlock, but it is insufficient to meaningfully lower prices in the face of persistent demand. The 4.1 months of supply, while an improvement from the record-low inventory levels of recent years, still falls short of a buyer’s market.
Industry analysts suggest that the market is unlikely to see a significant shift until there is a clearer path regarding future Federal Reserve interest rate policy. Until then, the housing market is expected to remain characterized by lower transaction volumes and a slow, steady adjustment in pricing expectations. For homebuyers, the current environment offers a rare opportunity to negotiate and perform due diligence without the pressure of competing against a dozen other offers. For sellers, the message is clear: the era of "list and sell" at any price has passed, and pricing accuracy is now the most critical factor in achieving a successful transaction.
As the market heads into the final quarter of 2026, stakeholders will be watching the interaction between interest rate stability and the seasonal decline in activity. With the economy showing signs of cooling in other sectors, the housing market’s resilience will continue to be a primary indicator of overall consumer confidence and financial stability in the United States.