
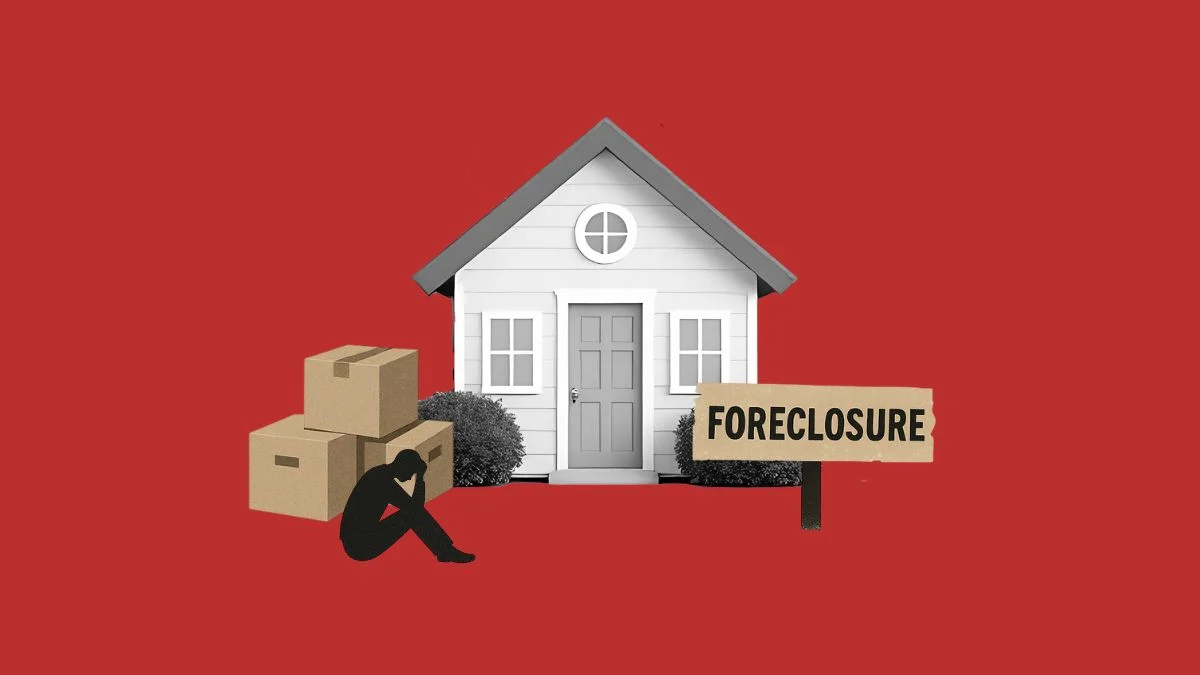
Recent data from property analytics firm ATTOM indicated a 21% year-over-year increase in foreclosure filings across the United States, a statistic that has ignited a firestorm of speculation regarding the stability of the American housing market. This uptick has been seized upon by various market commentators and public figures to suggest that a catastrophic collapse, reminiscent of the 2008 Great Financial Crisis, is imminent. Among those expressing concern was Andrew Yang, a former Democratic presidential candidate, who recently utilized social media to claim that financial pain is spreading to homeowners, citing the highest foreclosure rates in seven years and predicting further deterioration. However, a comprehensive analysis of the underlying economic data, regulatory environment, and historical context suggests that these fears are largely disconnected from the structural realities of the current market.
The narrative of an impending "foreclosure crisis" often relies on the selective use of percentage increases without accounting for the historically low baseline from which these figures originate. During the COVID-19 pandemic, federal and state governments implemented extensive foreclosure moratoriums and forbearance programs that effectively halted the legal process of property seizure for nearly two years. As these emergency measures expired, a natural return to "normal" foreclosure activity was expected. To understand the current landscape, it is essential to look beyond sensationalist headlines and examine the metrics that truly define market health: inventory levels, credit quality, homeowner equity, and the legal framework governing mortgage lending.
Dissecting the 21 Percent Year-Over-Year Increase
The 21% increase in foreclosure filings must be viewed through the lens of "stock versus flow." While the percentage sounds significant, the absolute volume of foreclosures remains well below historical averages. Market analysts note that for much of the post-World War II era, it has been standard for 1% to 4% of mortgage loans to be in some stage of delinquency. The current rise represents a normalization of the market rather than a systemic failure.
Data from the New York Federal Reserve’s Household Debt and Credit Report provides a critical counter-perspective. During the lead-up to the 2008 crash, bankruptcy and delinquency data began climbing as early as 2005, signaling a high-risk credit cycle that took years to build. In contrast, the current credit profile of the American homeowner is among the strongest in history. The "doom" narrative frequently ignores the fact that today’s market is characterized by a massive employment base, with over 162 million people currently in the workforce, providing a stable foundation for mortgage debt service that did not exist during the peak of the 2008 recession.
The Historical Precedent: 2008 versus 2024
To appreciate why a 2008-style crash is unlikely, one must examine the inventory levels of both eras. In 2007, the U.S. housing market was saturated with 4 million active listings. This massive oversupply, coupled with a sudden evaporation of demand, led to a rapid devaluation of property. Today, the market tells a different story. Active listings currently hover around 1.56 million, significantly lower than the 2 million to 2.5 million range considered "normal" for a balanced market.
Furthermore, the weekly "new listings" data serves as a vital barometer for credit distress. If a credit bust were occurring, the market would see a surge of distressed properties hitting the MLS (Multiple Listing Service). However, over the last five years, new listings have remained at historic lows. Even as mortgage rates fluctuated between 3% and 8%, the influx of new supply never reached the levels seen during the housing bubble, when new listings ran between 250,000 and 400,000 per week. Currently, the market is struggling to reach even 80,000 to 100,000 listings during seasonal peaks, indicating that homeowners are choosing—or are able—to stay in their homes.
Legislative Fortresses: Dodd-Frank and the Qualified Mortgage Rule
One of the most significant differences between the current era and the mid-2000s is the regulatory environment. The housing crash of 2008 was fueled by toxic lending products, including "NINJA" loans (No Income, No Job, no Assets) and subprime mortgages with aggressive interest rate resets. These products created a "payment shock" that forced many borrowers into default when their monthly obligations suddenly doubled or tripled.
In response to that crisis, the U.S. government enacted two transformative pieces of legislation: the Bankruptcy Abuse Prevention and Consumer Protection Act of 2005 and the Dodd-Frank Wall Street Reform and Consumer Protection Act of 2014. The latter introduced the "Qualified Mortgage" (QM) rule, which mandated that lenders verify a borrower’s ability to repay before issuing a loan. This eliminated the most predatory and unstable loan products from the system. As a result, the vast majority of current homeowners hold 30-year fixed-rate mortgages. This means that while inflation may drive up the cost of living and wages may rise, the homeowner’s primary debt obligation remains static, providing a hedge against the very payment shocks that triggered the previous collapse.
The Equity Buffer: Why This Cycle is Fundamentally Different
Perhaps the strongest argument against a foreclosure crisis is the unprecedented level of "nested equity" held by American homeowners. In 2010, at the height of the housing crisis, more than 23% of mortgaged homes were "underwater," meaning the owners owed more than the property was worth. This left distressed sellers with no option but short sales or foreclosures.
In 2024, the situation is reversed. Approximately 40% of American homes are owned outright, with no mortgage debt at all. For those with mortgages, the loan-to-value (LTV) ratios are exceptionally healthy. In 2008, the national average LTV was approximately 85%; today, it stands at 45.1%. This massive equity cushion acts as a fail-safe. If a homeowner faces financial hardship today, they are far more likely to sell the home on the open market and walk away with a profit rather than surrender the property to a bank. The presence of equity transforms a potential foreclosure into a standard real estate transaction, preventing the "fire sale" downward pressure on prices that characterizes a crash.
The Foreclosure Process: A Long Road from Default to Sale
It is also important to recognize that foreclosure is a protracted legal process, not an instantaneous event. The journey from a missed payment to a bank-owned property typically involves a 30, 60, 90, and 120-day late notice period, followed by a formal Notice of Default. Depending on state laws, the legal proceedings can take anywhere from six months to several years.
Because of this timeline, any genuine "wave" of foreclosures would be visible in the data years before it impacted market prices. Currently, the data shows only a return to pre-pandemic norms. There is no evidence of a massive buildup of "zombie foreclosures" or hidden distressed inventory that would be sufficient to overwhelm the current demand. In fact, with supply still so constrained, any increase in foreclosure-related inventory would likely be absorbed quickly by a market that has been starved for listings for nearly a decade.
Economic Implications and the Stability of the Modern Homeowner
The broader economic implications of the current housing data suggest stability rather than volatility. While high interest rates have cooled the pace of sales, they have not triggered a price collapse because the "forced selling" mechanism is absent. Most homeowners are "locked in" to low interest rates (often under 4%), making their monthly housing costs significantly lower than the cost of renting an equivalent property or financing a new home at current rates.
Economists point out that for a true foreclosure crisis to manifest, the U.S. would need to see a massive spike in unemployment that specifically targets the demographic of homeowners. While the tech sector and some white-collar industries have seen layoffs, the overall labor market remains resilient. Without a significant "job-loss recession," the catalyst for a systemic wave of defaults is missing.
Conclusion: Navigating Market Sentiment with Data
The resurgence of "doom porn" in the real estate sector highlights a disconnect between social media narratives and empirical economic data. While a 21% year-over-year increase in foreclosure filings makes for a compelling headline, it lacks the context of the post-pandemic recovery and the structural shifts in the American mortgage market over the last fifteen years.
With historically low inventory, high homeowner equity, and the protection of the Qualified Mortgage rule, the U.S. housing market is operating under a completely different set of rules than it did in 2008. Investors, homeowners, and policymakers should look to the New York Fed’s credit reports and weekly listing data rather than reactionary social media posts to gauge the true health of the market. The data suggests that while the market is adjusting to a higher-rate environment, the foundation remains firm, and the "floodgates of doom" remain firmly shut.