
The United States housing market, which has demonstrated remarkable resilience throughout the first half of 2026, is entering a period of renewed uncertainty as macroeconomic headwinds and geopolitical instability converge. Despite enduring a landscape defined by persistent inflation, fluctuating energy costs, and a labor market adjusting to the widespread integration of artificial intelligence, the residential real estate sector has managed to maintain stability. However, as mortgage rates hover at a critical psychological and financial threshold of 6.64%, and as the conflict involving Iran escalates into a more volatile second phase, analysts are questioning whether the current pace of transactions can be sustained.
The most recent tracking data indicates a subtle but perceptible deceleration in market momentum. This shift coincides with mortgage rates remaining above the 6.64% mark for much of the previous week, a level that has historically served as a resistance point for buyer demand. Furthermore, the market is now approaching a period of "harder year-over-year comparisons." In mid-June 2025, the housing market experienced a notable shift in activity, setting a high bar for growth in the current year. As the industry moves into the second half of 2026, the ability to show positive year-over-year growth will require a significant increase in volume that may be difficult to achieve under current conditions.
Geopolitical Instability and the Federal Reserve’s Reaction
The escalation of the Iran conflict into what observers are calling "Stage 2.0" has introduced a significant variable into the 2026 housing forecast. Geopolitical tensions in the Middle East traditionally exert upward pressure on global oil prices, which in turn fuels domestic inflationary concerns. For the Federal Reserve, rising energy costs represent a complication in their efforts to stabilize the economy. While the central bank often remains silent when oil prices decline, the "hawkish" contingent of the Federal Open Market Committee (FOMC) has historically used rising oil prices as a justification for maintaining or increasing restrictive monetary policies.
During the past week, Federal Reserve officials have been increasingly vocal regarding the risks posed by external shocks to the inflation trajectory. These statements, combined with the negative headlines emerging from the conflict zones, have kept the 10-year Treasury yield—the primary benchmark for mortgage pricing—near the upper bound of forecasted ranges. If the conflict continues to intensify, particularly impacting the Strait of Hormuz or global energy distribution, the resulting pressure on bond yields could push mortgage rates well beyond the current comfort zone of many prospective buyers.
The Critical Role of Mortgage Spreads in 2026
A defining characteristic of the 2026 housing market has been the behavior of mortgage spreads—the difference between the 10-year Treasury yield and the 30-year fixed mortgage rate. Historically, these spreads have fluctuated between 1.60% and 1.80%. However, the post-pandemic era saw these spreads widen significantly due to market volatility and decreased liquidity in the secondary mortgage market.
In 2023, spreads were so wide that current bond yields would have resulted in mortgage rates approaching 8%. In 2024 and 2025, similar conditions would have kept rates consistently above 7%. In the current environment, spreads have shown relative improvement, recently measuring at 1.97% compared to 1.95% the week prior. This compression, while still above historical norms, has been the primary factor keeping mortgage rates below the 7% threshold for much of the year.
Market analysts suggest that without this improvement in spreads, housing demand would have likely entered a severe contraction. Demand historically falters when rates exceed 7%, and the current market relies heavily on rates staying within the 6.25% to 6.64% range to facilitate movement. The slight widening of the spread last week, however, serves as a warning that the "buffer" protecting the market from higher rates may be thinning.
Analysis of Pending Sales and Purchase Applications
To understand the immediate health of the market, economists look to weekly pending sales and mortgage purchase application data. These metrics serve as leading indicators, typically forecasting actual closing data by 30 to 60 days. Recent figures show a complex picture of consumer sentiment.
The traditional dip in activity surrounding the Fourth of July holiday was observed two weeks ago, followed by a standard rebound in the most recent reporting period. However, when adjusted for year-over-year comparisons, the demand was slightly negative. This trend is particularly concerning given that mortgage rates spent the majority of the week above the 6.64% "danger zone."
Purchase application data reinforced this narrative, showing a 7% week-over-week decline. While a weekly drop is common for this specific point in the calendar, the 2% year-over-year decline marks only the third negative print of 2026. This suggests that the pool of active, qualified buyers may be reaching a point of exhaustion, or at the very least, a point of extreme sensitivity to rate fluctuations. As the market enters a phase where rates in 2025 were lower than those currently available, the year-over-year comparisons for purchase applications are expected to become increasingly challenging.
Inventory Dynamics and the New Listing Environment
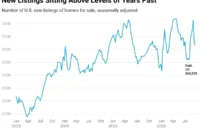
A persistent theme in the 2026 housing market has been the scarcity of available inventory, though the reasons for this scarcity have evolved. Since mid-June 2025, inventory growth has slowed considerably, with many weeks in the past two months showing negative year-over-year growth. Following the holiday-related decline, inventory saw a modest rebound, but it remains far below the levels required to transition to a "balanced" market.
The seasonal peak for new listings typically occurs in the late spring and early summer. Historically, a healthy market would see between 80,000 and 100,000 new listings per week during this period. In 2026, however, the market has only surpassed the 80,000-listing mark four times, and never in consecutive weeks. Despite this, the listing data for 2025 and 2026 remains superior to the "trough" years of 2023 and 2024.
This improvement is attributed to the fact that many sellers in the current market are also buyers. The "lock-in effect," where homeowners are reluctant to trade a low mortgage rate for a higher one, has begun to thaw slightly as life events—such as job changes or family growth—necessitate moves regardless of interest rate environments. However, the current volume is a far cry from the housing bubble years of 2006-2008, when new listings frequently ranged from 250,000 to 400,000 per week. This historical context refutes suggestions that the current market is approaching a bubble-burst scenario driven by oversupply.
Price Adjustments and National Valuation Trends
Home price growth in 2026 has defied some earlier, more bearish forecasts. Initial projections for the year suggested a slight national decline in home prices, with some models calling for a 0.62% reduction. Contrary to these expectations, most major home price indexes are currently reflecting growth of 1% to 2% on an annual basis.
This price resilience is closely linked to the percentage of price cuts observed in the market. Typically, about one-third of all listings undergo a price reduction before a sale is finalized. In 2026, the percentage of price cuts has been lower than in the previous year. This is a direct consequence of the slowing inventory growth; when fewer homes are available, sellers feel less pressure to reduce prices to compete.
However, if mortgage rates remain elevated due to the Iran conflict or if the 10-year yield breaks out of its current channel, the pressure on prices may intensify. For now, the lack of supply continues to act as a floor for valuations, preventing the widespread price corrections that were anticipated at the start of the year.
Chronology of Market-Moving Events: July 2026
The following timeline outlines the key events that have shaped the current market environment:
- July 1–4: Traditional seasonal slowdown as the U.S. observes the Independence Day holiday. Mortgage purchase applications see a sharp but expected weekly drop.
- July 5–10: Reports emerge of "Stage 2.0" escalations in the Iran conflict, including threats to maritime trade routes. Oil prices begin a steady ascent, sparking concerns within the Federal Reserve.
- July 11–14: Mortgage rates climb back above 6.64%, tracking the rise in the 10-year Treasury yield. Federal Reserve "hawks" issue statements emphasizing that inflation remains the primary target, suggesting that rate cuts are not imminent.
- July 15–18: Weekly data reveals that despite a post-holiday rebound, pending sales and purchase applications are trending negative year-over-year. Mortgage spreads widen slightly to 1.97%.
- July 19–20: High-profile headlines regarding the geopolitical situation dominate the weekend news cycle. Analysts prepare for potential volatility in the bond market as trading opens on Monday.
Broader Implications and the Path Forward
As the market looks toward the final months of 2026, the primary concern remains the intersection of geopolitical risk and domestic monetary policy. The housing market has proven it can function with mortgage rates in the mid-6% range, provided that inventory remains tight and the labor market remains stable. However, the introduction of a major conflict involving a key oil-producing nation threatens to disrupt this delicate balance.
If oil prices continue to rise, the Federal Reserve may be forced to maintain higher interest rates for longer than the market has priced in. This would likely keep mortgage rates above the 6.64% threshold, further dampening demand and potentially leading to a more significant slowdown in sales volume. Conversely, if the conflict is de-escalated or if the economy shows signs of cooling that outweigh inflationary concerns, a retreat in bond yields could provide the housing market with the "breathing room" it needs to finish the year on a positive note.
The upcoming week will be pivotal, featuring new home sales data and several Treasury bond auctions. These events will occur against the backdrop of an active conflict, marking a shift from previous weeks where geopolitical news broke primarily while markets were closed. Investors and housing professionals alike will be watching the 10-year yield closely, as its movement will dictate whether the 2026 housing market remains a story of resilience or becomes one of retreat.